October 1, 2025
•
8 min read

Most support teams can only estimate deflection. Here's how to calculate a deflection metric from your JSM help center, and what to report alongside it.
Ticket deflection is when a customer resolves an issue through self-service, usually a help article, and doesn't need to submit a ticket. It's the main return on a help center. Every deflected ticket is agent time spent on problems that need a person.
JSM does have a deflection report. Its Requests deflected report counts a deflection when a customer is raising a request in the portal, selects a suggested article, and votes it helpful. That's a real signal, but it depends on the customer taking an extra step after their problem is solved. A customer who reads the answer and closes the tab isn't counted.
So teams lean on other proxies too, such as article views and ticket volume. These hold up until someone in a budget meeting asks how many tickets the help center actually prevented. Article views don't link to a ticket that didn't happen. Ticket volume moves for plenty of reasons unrelated to help content, like a product release, a pricing change, or a new customer cohort.
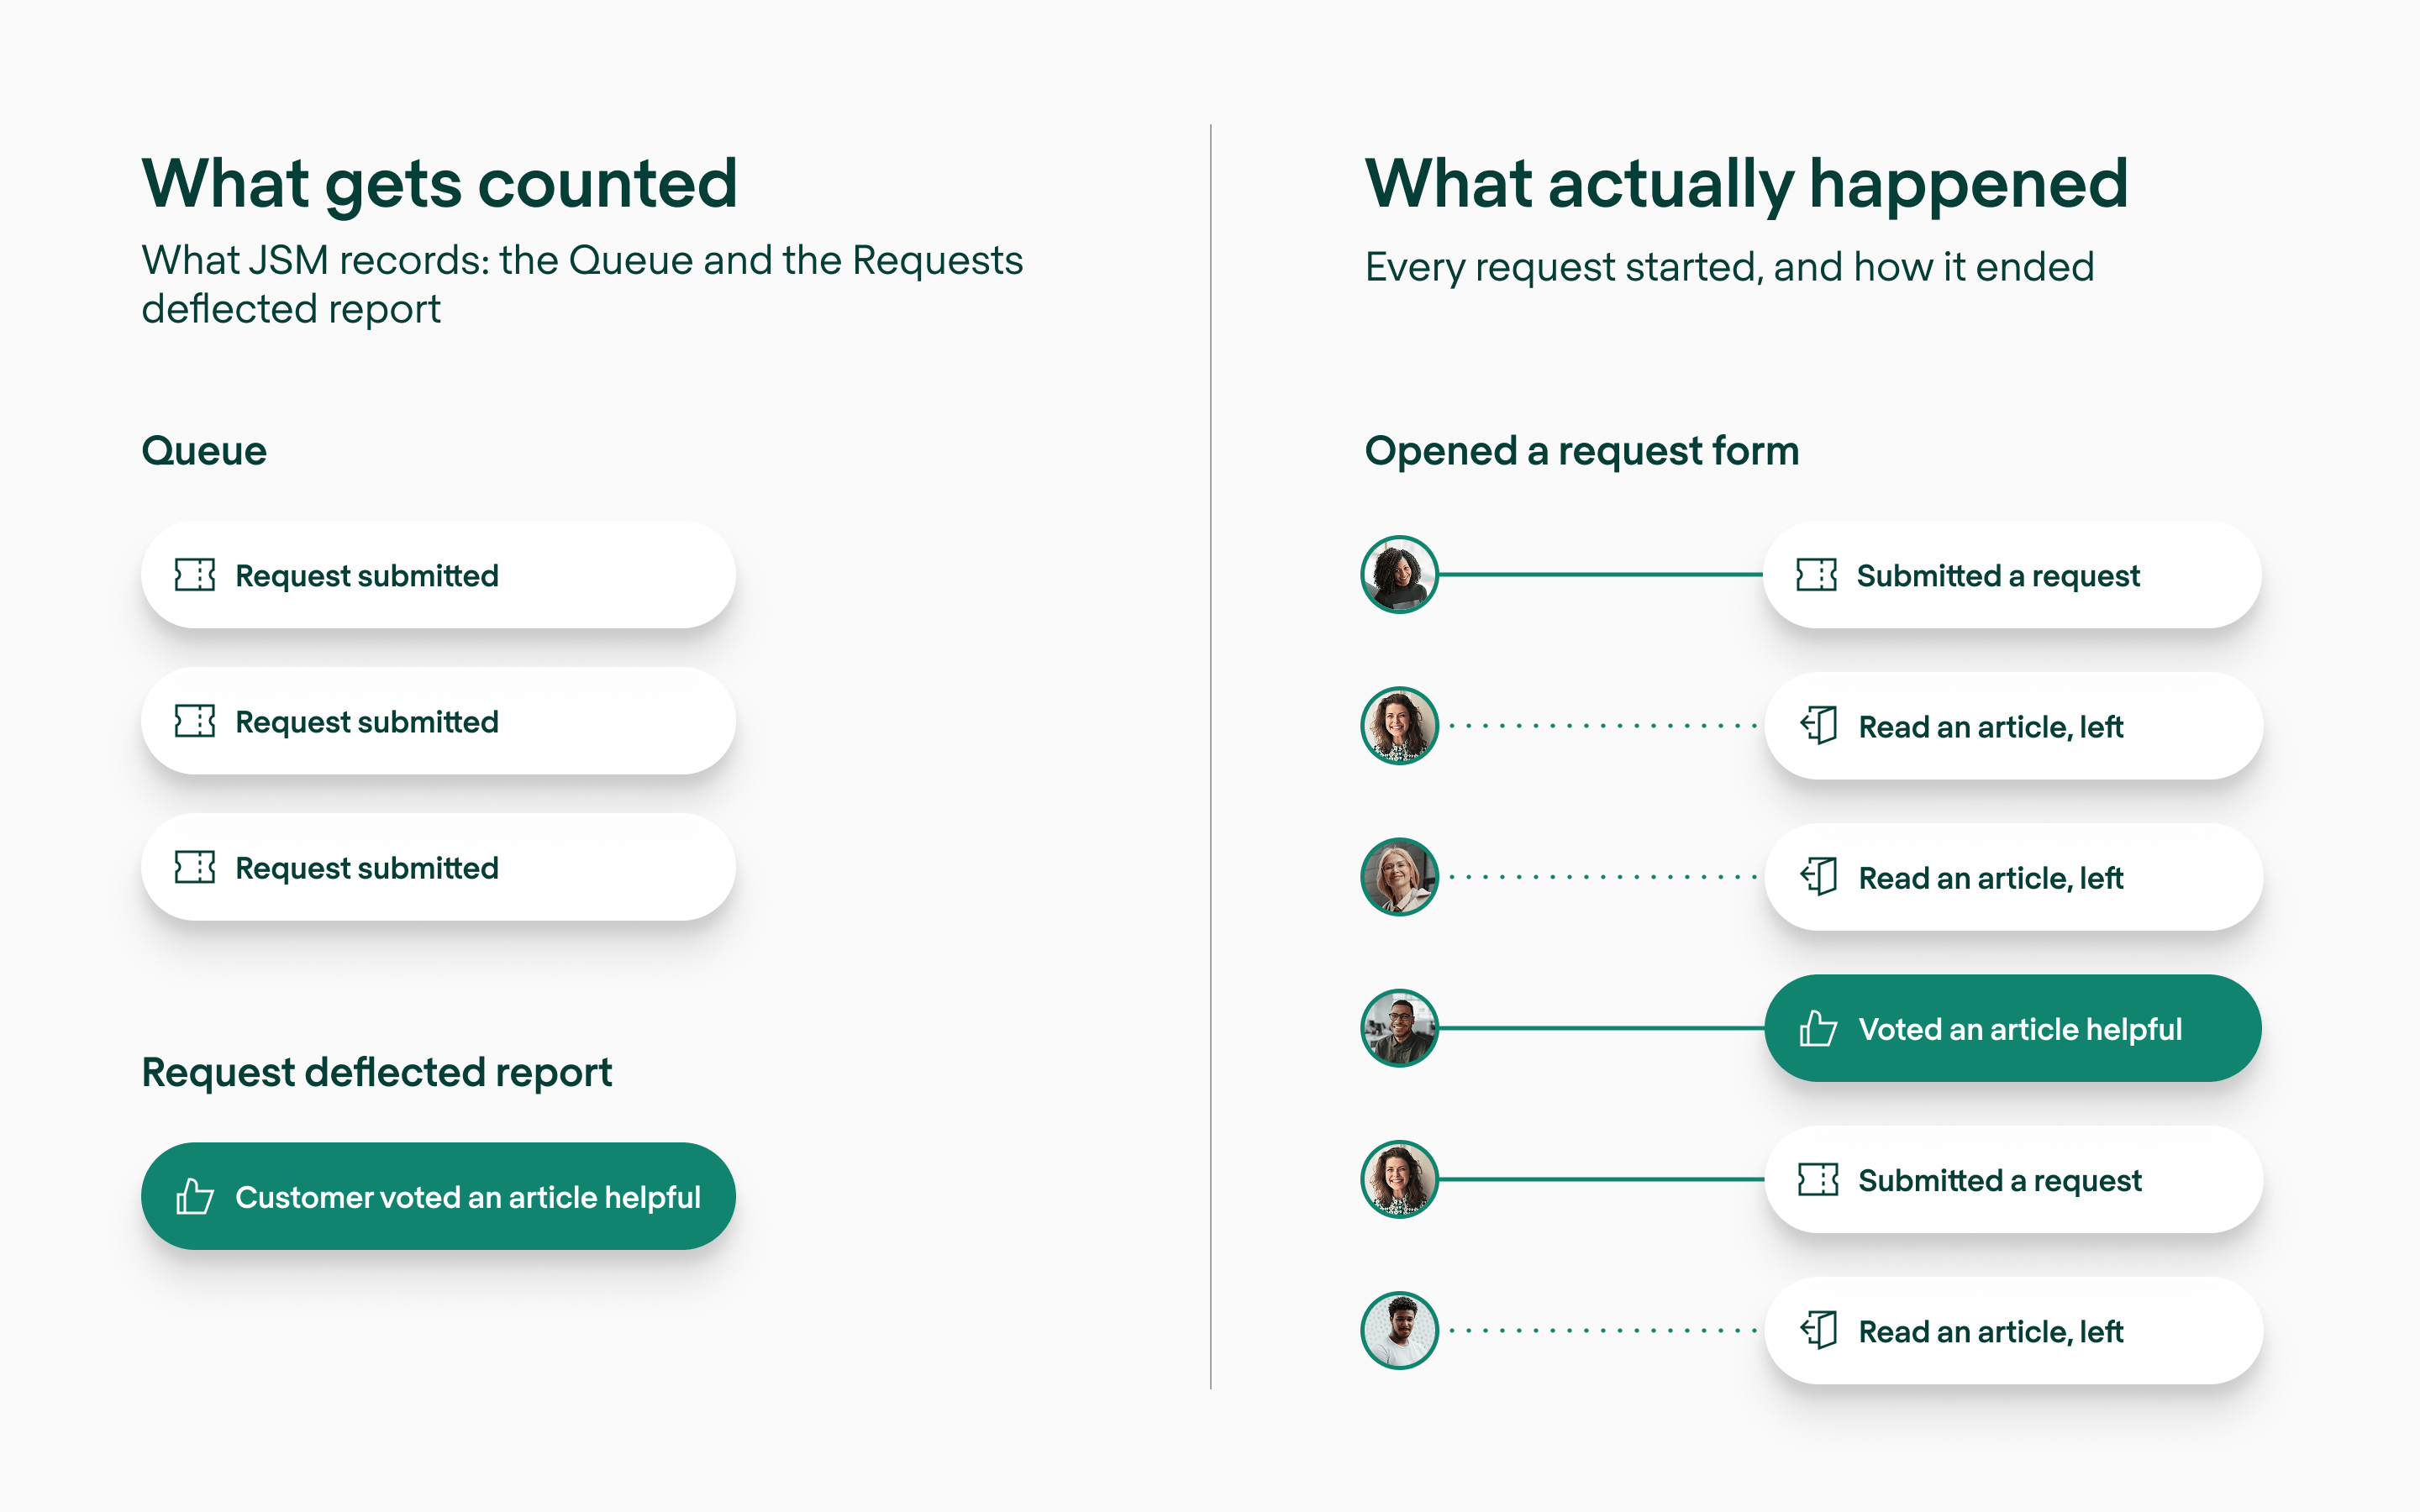
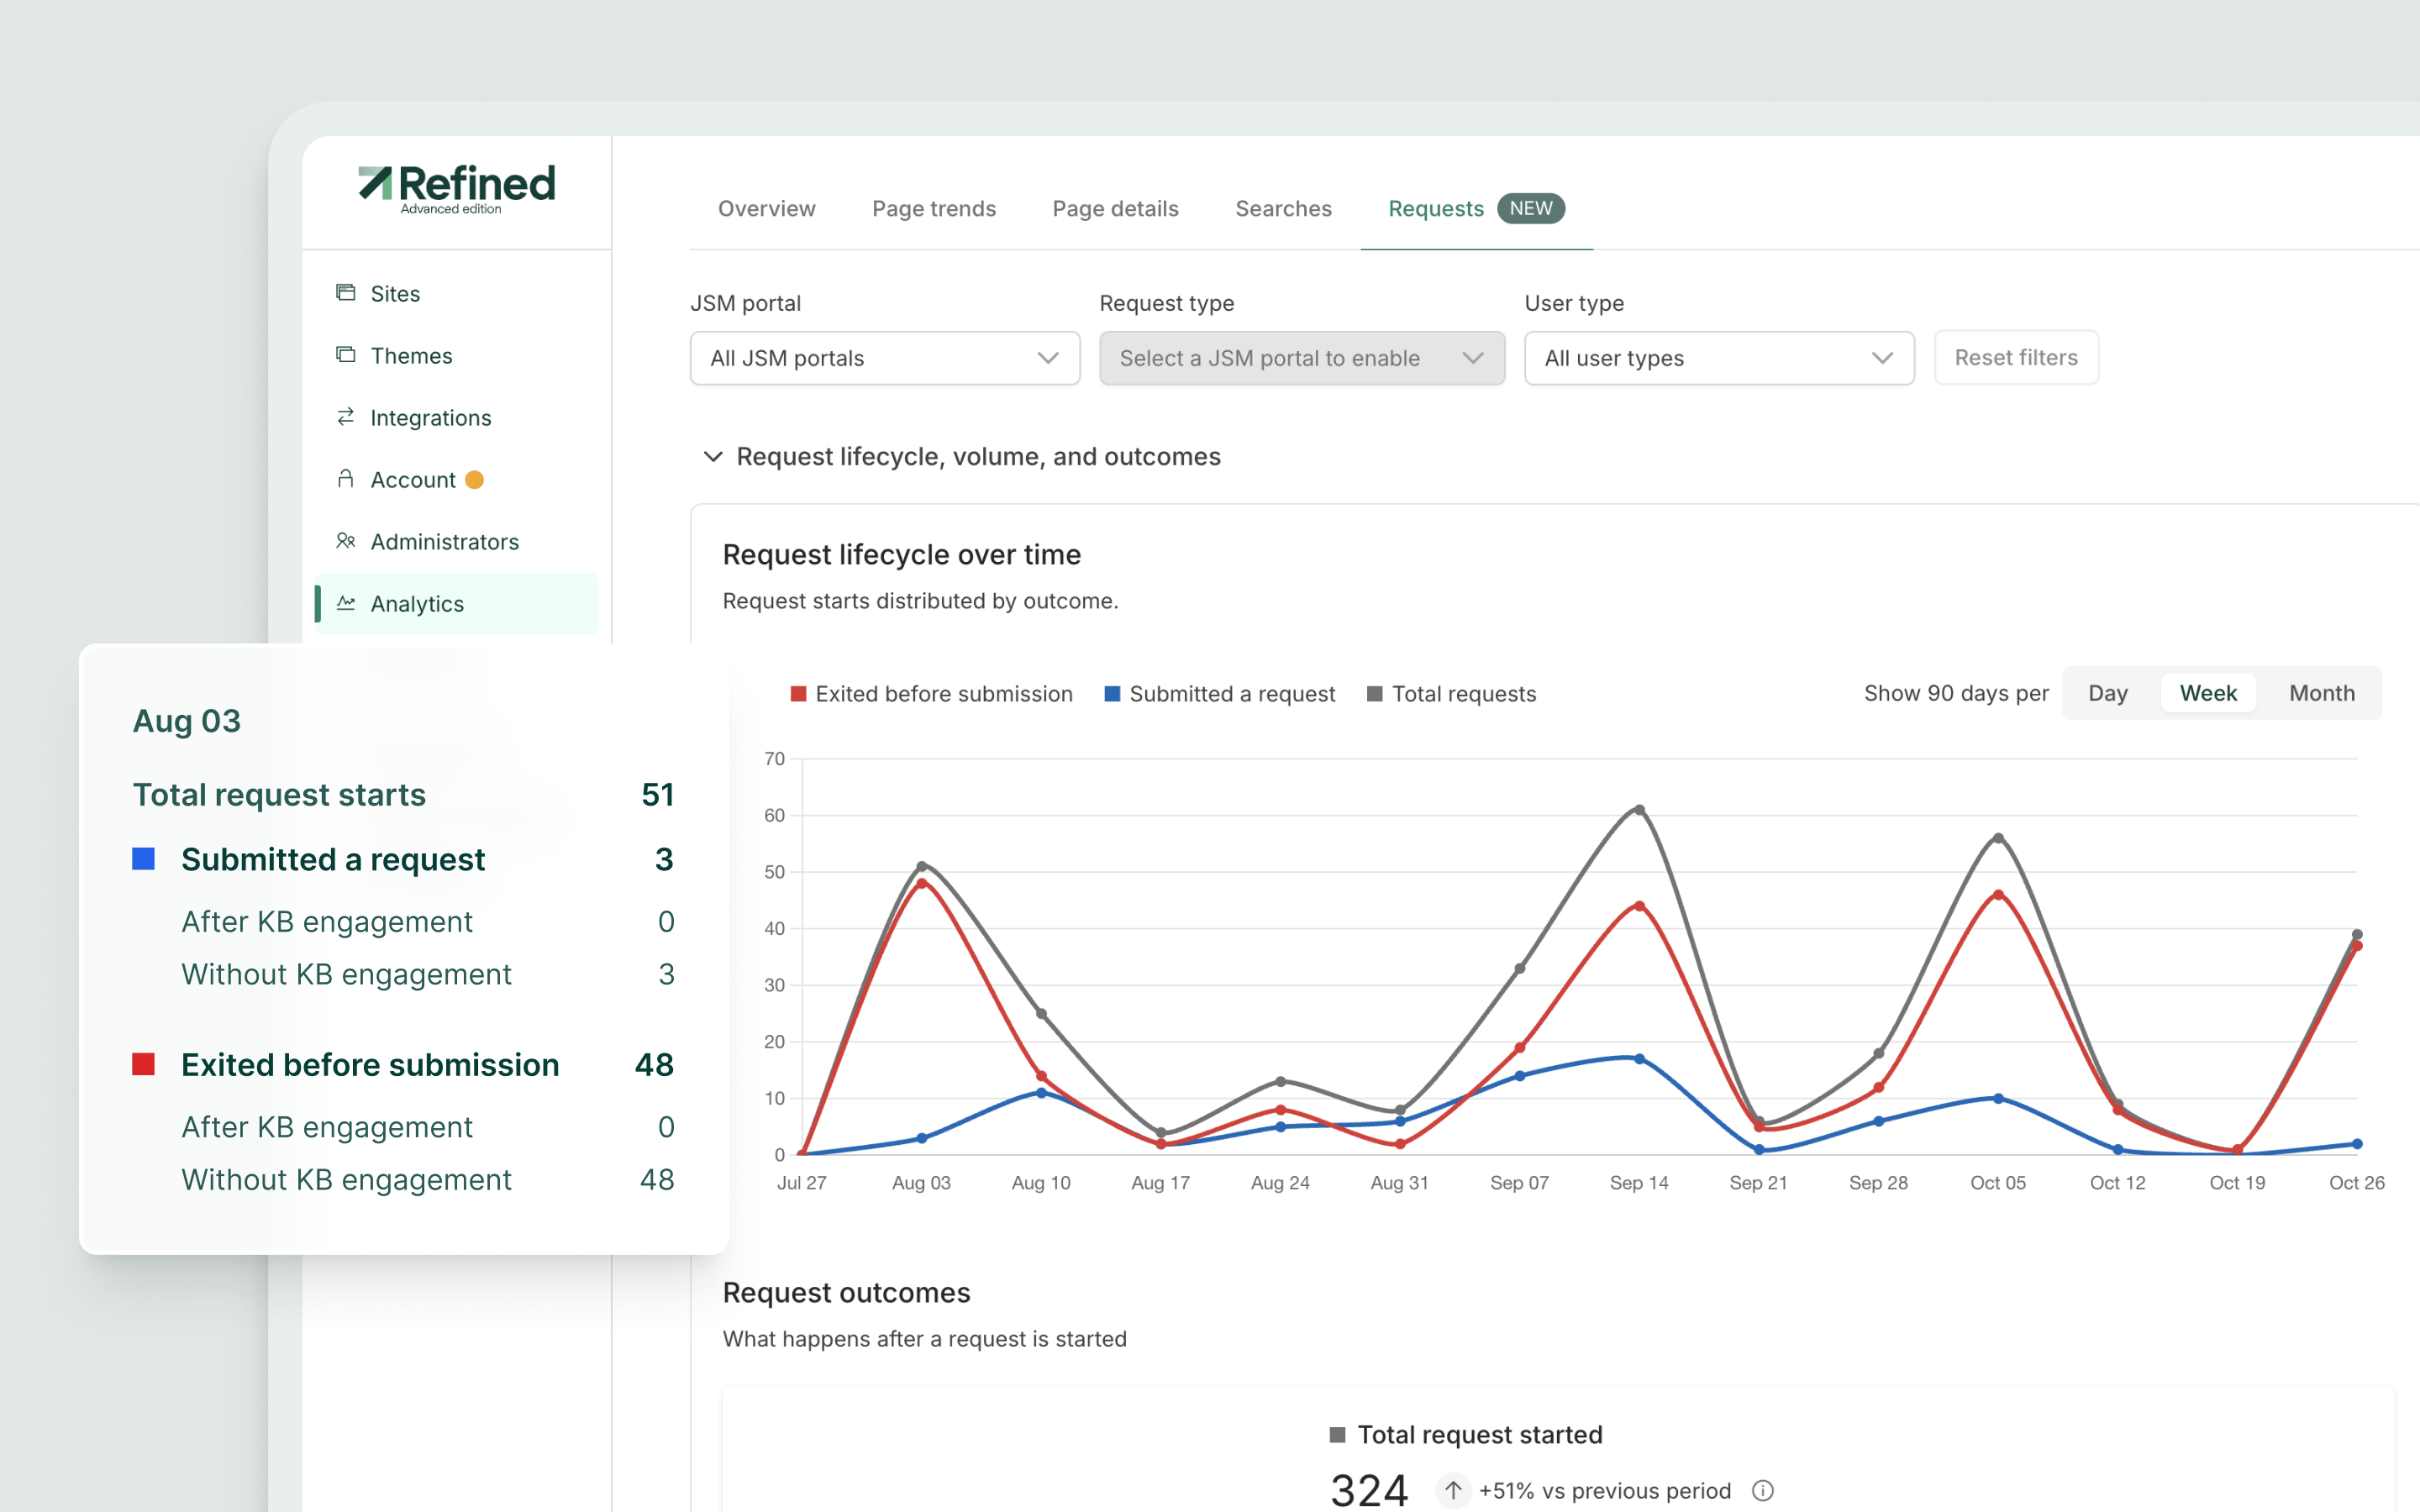
Start counting when a customer opens a request form. Every request then ends with a submission or an exit, and you know whether the customer read a help article along the way. Service analytics tracks exactly this for help centers built with Refined. It counts an article interaction when the customer views a knowledge base article for at least 60 seconds during the request.
That gives you a metric:
Likely deflection rate in % = (Requests exited after an article interaction ÷ Requests started) x 100
For example, say customers started 1,000 requests last month and 180 of them ended without a submission after the customer read an article. Your likely deflection rate is 18%.
The word "likely" matters. An exit after reading suggests the customer found the answer, but it doesn't confirm the problem was solved, and some customers will come back through another channel. Say so in your report. A conservative number with a clear method holds up better under questioning than a big number with no method behind it.
A deflection rate on its own rewards fewer tickets, even if customers are struggling to get them. Put these next to it:
We think about knowledge and service as a flywheel. Context feeds experience, experience produces outcome signals, and optimization turns those signals into better context. Measuring deflection is the step where your help center produces those signals. It turns into improvement once you act on it.
Service analytics is part of the Advanced edition. Start tracking now, and next quarter you'll have a baseline to compare against.
Or, if you aren’t already using Refined Sites for JSM.